 FORGE
VWAP
The session’s volume-weighted average price: where trading has really taken place.
What it measures
The VWAP (volume weighted average price) is the average price at which trading has taken place since a starting point, giving more weight to the prices where there was more volume. It isn’t an average of closes: each price weighs as much as the number of contracts that changed hands at it.
It resets at the start of each period (the session, the day, the week…) and accumulates from there. Many desks use it as a reference for the day’s “fair price”: if price is above it, the average of what has traded sits below, and vice versa.
How it’s calculated
VWAP = Σ (price × volume) ÷ Σ volume
- With footprint, each price of each candle enters with its volume. In Volume used for weighting you can choose Total, only the Bid or only the Ask.
- Without footprint, the candle’s close enters with the candle’s volume (at least 1).
- TWAP: with Weight by set to TWAP, each candle weighs the same, with its close, whatever its volume.
The bands are calculated from the weighted standard deviation of the prices in that same period:
Band = VWAP ± k × deviation
with k = 1, 2 and 3 by default (you can change them). They’re drawn above and below, up to three pairs.
When it resets
The Anchor (reset) decides where accumulation starts. Asia, Globex and RTH use Forge’s session hours; Session and Custom use the hours you write in Session, in New York time (09:30 to 16:00 by default). With these five, candles outside the window are neither included nor drawn: the line appears when the window starts and disappears when it ends. Daily (the default, and its synonym Day), Week and Month cover all candles and reset with the day, the week or the month, at the 18:00 New York open. Each period is a separate piece: the line and the bands are cut at the reset, with no join to the previous period.
How to read it
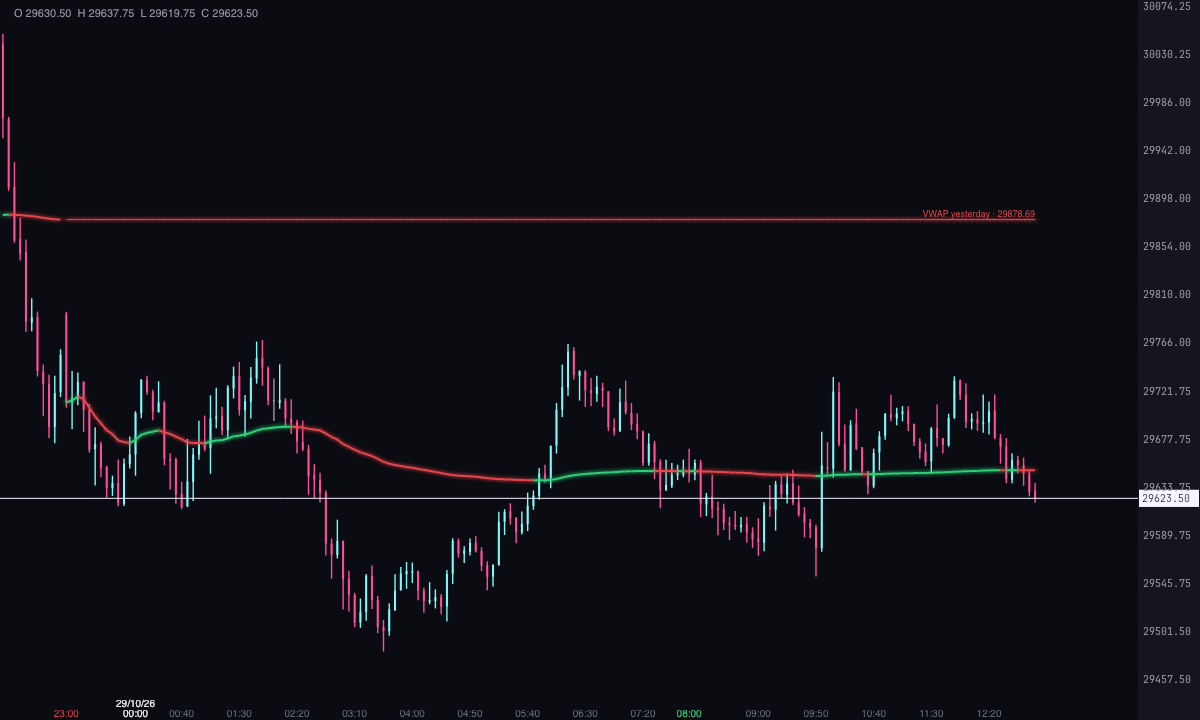
- Price above the VWAP: what has traded in the period sits, on average, below the current price. Below the VWAP, the opposite. By default the color shows it: green with price above, red with price below.
- Slope: a rising line says the accumulated average price keeps going up. With Color by whether the VWAP rises or falls you see it at a glance.
- Bands: they measure how far price has moved away from its average, in deviations. The farther away, the more extreme relative to what traded in the period.
- Previous close: the dashed line is the value the VWAP of the previous period ended at, drawn across the new period. It serves as a reference level. By default it also changes color: green with price above, red with price below. Its label carries the price and says which period it belongs to: VWAP yesterday, VWAP last week or VWAP last month.
The VWAP isn’t a signal: it marks an average, it doesn’t say what price is going to do.
Adding it to the chart
In the chart bar, Indicators ▾ › More Indicators…. You’ll find it in the Volume / Order Flow category. It’s drawn over the price. How to add and adjust an indicator is in Indicators.
Settings
Open them with the ⚙ on its row in Indicators ▾. Each section collapses and expands on its own.
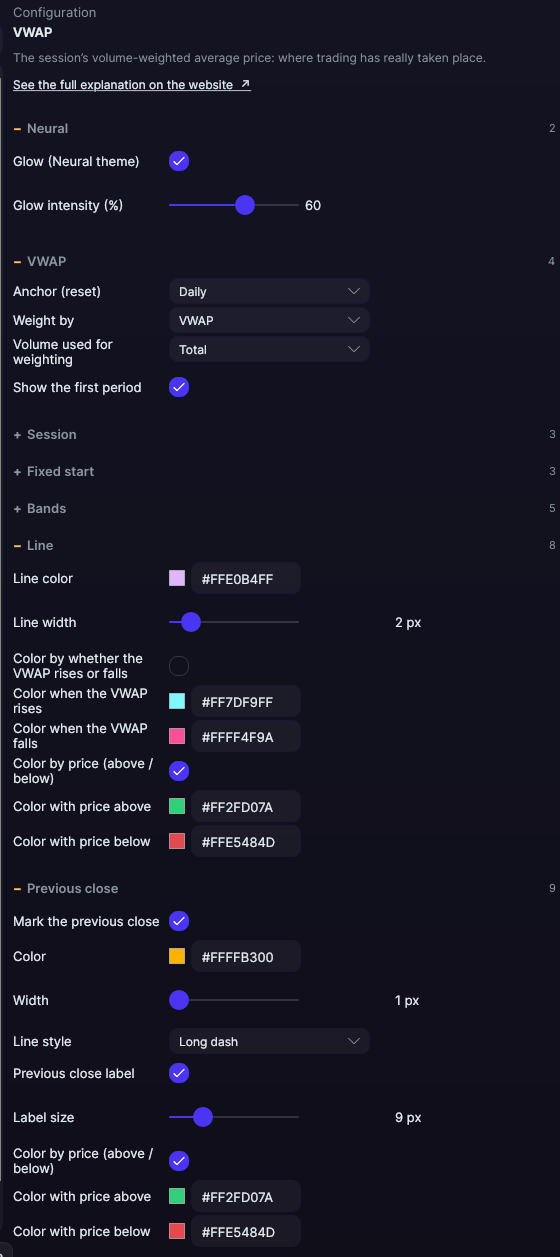
| Setting | Default | What it does |
|---|---|---|
| VWAP | ||
| Anchor (reset) | Daily | Session, Daily, Asia, Globex, RTH, Custom, Day, Week or Month: when accumulation starts again. |
| Weight by | VWAP | VWAP (by volume) or TWAP (by time, each candle weighs the same). |
| Volume used for weighting | Total | Total, Bid or Ask. Only counts with footprint and in VWAP mode. |
| Show the first period | Yes | If you turn it off, the chart’s first period (which often starts partway through) is accumulated but not drawn. |
| Session | ||
| Start (Custom only) · End (Custom only) | 09:30 · 16:00 | The window, in New York time, chosen from a drop-down with every hour of the day, minute by minute. They apply with Custom and with Session; with Asia, Globex, RTH or Daily, Forge’s hours rule. |
| Days (0 = all) | 0 | Calculates only the last days you specify. 0 = the whole chart. |
| Fixed start | ||
| Anchor at a fixed point | No | Accumulates from a specific moment, and draws nothing before it. |
| Start (yyyy-MM-dd HH:mm NY) | Empty | The moment, in New York time, in that format. |
| Reset at each session | Yes | With the fixed point on, it starts over with each session. Off, it accumulates from the point without resetting. |
| Bands | ||
| Draw the bands | No | Shows up to three pairs of bands, above and below, dashed. |
| Deviation 1 · Deviation 2 · Deviation 3 | 1 · 2 · 3 | How many deviations separate each band from the line. |
| Bands color | Violet | The color of all six; they’re drawn semi-transparent. |
| Line | ||
| Line color | Lilac | The color of the line with both color checkboxes off. |
| Line width | 2 px | From 1 to 10 px. |
| Color by whether the VWAP rises or falls | No | Each segment takes the color of whether the VWAP rises or falls relative to the previous candle. If you turn it on, it overrides the color by price. |
| Color when the VWAP rises · Color when the VWAP falls | Ice · Pink | With Color by whether the VWAP rises or falls. |
| Color by price (above / below) | Yes | Each segment takes one color with price above and another with price below; it changes every time price crosses it. |
| Color with price above · Color with price below | Green · Red | With Color by price (above / below). |
| Previous close | ||
| Mark the previous close | Yes | Draws the value the previous period’s VWAP ended at. |
| Color · Width | Orange · 1 px | From 1 to 10 px. The color applies with Color by price (above / below) off. |
| Line style | Long dash | Solid, Long dash, Short dash, Dotted or Long dash-dot. |
| Previous close label | Yes | A text with the price and the period, at the end of the line. |
| Label size | 9 px | From 7 to 16 px. |
| Color by price (above / below) | Yes | Each segment takes one color with price above and another with price below; it changes every time price crosses it. |
| Color with price above · Color with price below | Green · Red | With Color by price (above / below). |
| Neural | ||
| Glow (Neural theme) | Yes, when added | A halo of light in the color of each line or mark, like the one on the Neural theme candles. A newly added indicator comes with it checked; the ones you already had saved don’t. |
| Glow intensity (%) | 60% | From 0 to 100%. |
Settings belong to each chart: changing the VWAP on one chart doesn’t change it on another.